BI Dashboards & Reporting
Elewix Interactive Business Intelligence Dashboards for Data-Driven Decisions
In today’s fast-paced business environment, making the right decision quickly matters. With Elewix BI Dashboards, we help you transform your data from multiple sources into clear, actionable insights all displayed in intuitive dashboards. Whether it’s sales, operations, finance, marketing, or performance tracking our BI dashboards give you a real-time, unified view of key business metrics (KPIs), helping you monitor performance, spot trends, and make data-driven decisions confidently.

“Business intelligence dashboard showing charts, graphs and KPIs on screen BI dashboards illustration”
What We Provide
What We Provide
“Team meeting reviewing performance metrics on large BI dashboard display data-driven decision making”
What Is a BI Dashboard & Why It Matters
A BI dashboard is a data-visualization and analytics tool that aggregates key metrics, KPIs, and reports onto a single, interactive interface.

Instead of sifting through spreadsheets or scattered reports, a well-designed BI dashboard brings together data from multiple sources sales systems, finance, CRM, operations, web analytics, etc. offering a consolidated view of business performance.

Why it matters:

We’ve Got Answers
We’ve Got Answers

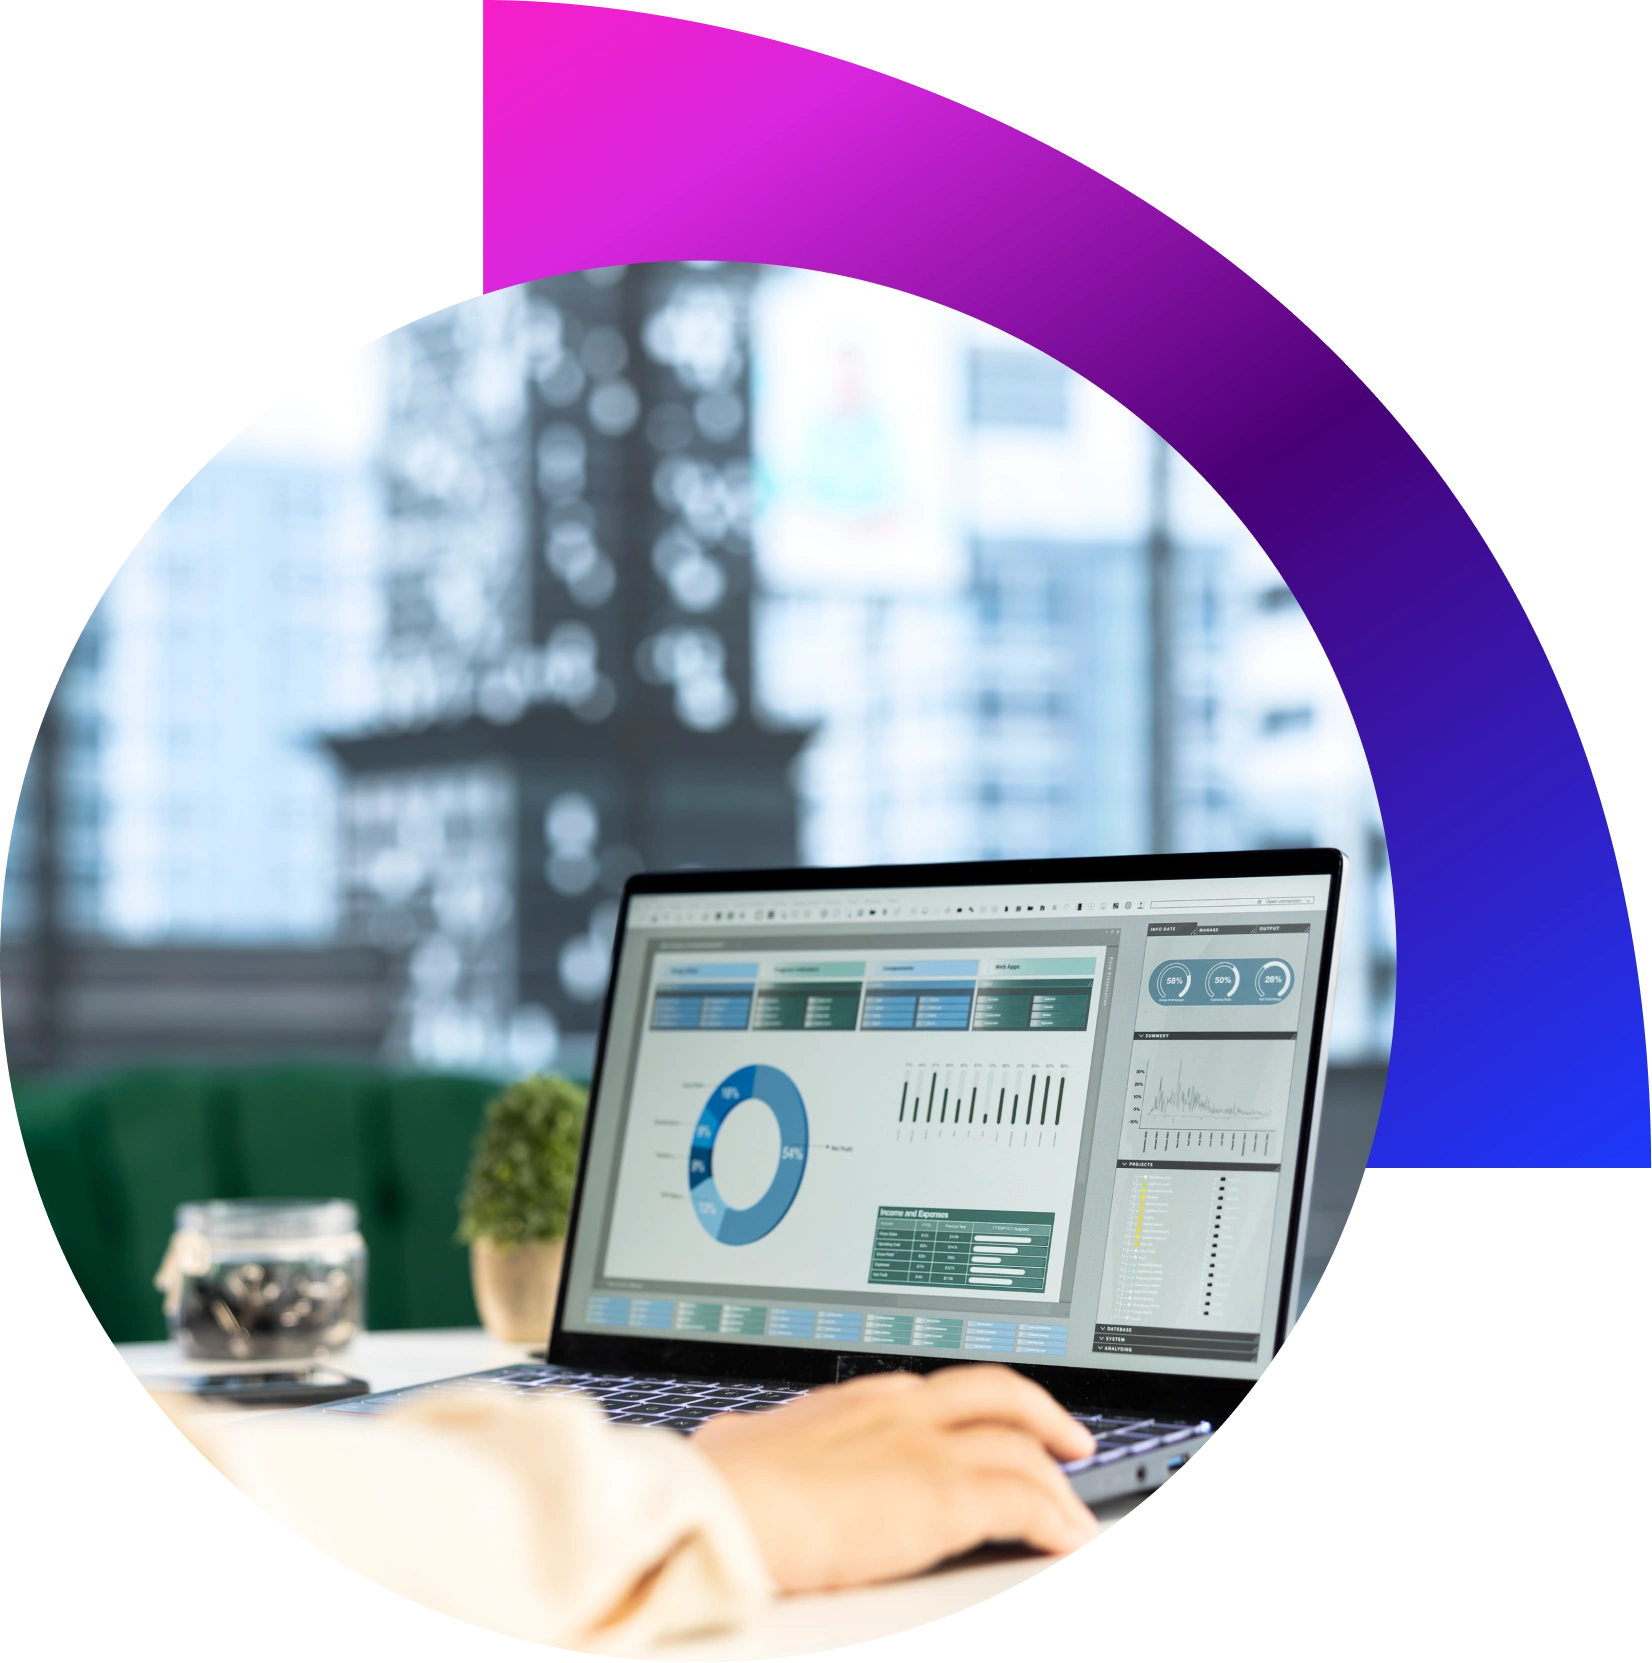
A BI dashboard is a tool that displays key metrics, KPIs and data visualizations on a single screen, offering at-a-glance insights into business performance. It helps businesses monitor operations, track performance, and make data-driven decisions quickly.

Almost any data sales data, financials, marketing metrics, operational data, web analytics, user behavior, inventory levels, CRM data, etc. Because dashboards connect to various data sources, they aggregate and visualize data based on your needs.

Yes when configured with real-time/near-real-time data pipelines, dashboards can update live or at defined intervals ideal for operations, sales tracking, web analytics, or performance monitoring.

BI dashboards are designed for business users, managers, executives not just data analysts. With intuitive charts and interactive visuals, non-technical users can access and interpret insights without deep technical knowledge.

Dashboards help in monitoring performance (sales, operations, marketing), spotting trends or issues early, resource allocation, forecasting (with integrated analytics), strategy planning, and overall business oversight enabling informed and timely business decisions.

Elewix delivers full-stack BI dashboard solution: data integration from multiple sources; custom KPI mapping; dashboard design; interactive visualization & reporting; real-time or scheduled data updates; access control & sharing; and analytics-ready setup for ongoing decision support.

Want to transform your data into actionable insights and make smarter decisions?